When you are trying to take over the data center moving out from the switch and into servers, as Cisco Systems is trying to do, you have to try to figure out the lay of the land so you can pick your targets and start shooting. That, in a nutshell, is why Cisco has put together its latest Global Cloud Index, complete with lots of data mashups and prognostications.
It is a bit puzzling why Cisco is sharing this data with the world, and hence its competitors, but anything that promotes the build out of new networks and server infrastructure helps Cisco’s cause as a provider of converged systems that are generally going into greenfield installations.
Cisco gets virtualization and storage through its partnership with EMC, but it may run out of patience there at some point and decide it needs the whole stack itself and start doing storage and virtualization. It could buy Citrix Systems in a heartbeat, for instance. But it is probably that Cisco just likes to say “zettabytes” and see how much network traffic is expected to grow because those bytes are future earnings for the company.
There’s a deluge of arts and charts and FAQs in the latest Global Cloud Index report, which spans from 2011 through 2016 and which tries to figure out how traffic in the data center and between data centers will change over that five year term as well as try to reckon the growth in cloudy server workloads within those data centers.
Both are, as El Reg pointed out, like money in the bank for Cisco if it can keep its market share for data center switching stable and keep increasing its server market share.
This is the second iteration of Cisco’s Global Could Index, which was first published in November 2011 and spanned from 2010 through 2015, and it looks like traffic is growing a bit faster over the next four years than Cisco was anticipating a year ago.
Shruti Jain, a senior analyst in Cisco’s service provider unit, tells El Reg how these projections are made. First, Cisco has monitoring software installed in ten large data centers and monitors the monthly traffic from these data centers, comprising 40TBs of traffic. Cisco doesn’t reveal who these data centers are, but Jain says that it includes a few big public clouds as well as private data centers.
This traffic data is then extrapolated across the entire population of millions of data centers in the world to get a sense of how much data is whirring around as servers, storage, and appliances all talk to each other through switches, data centers communicate with each other, and end users access applications running within the data center.
The company also does over 45 million speed tests from 150 countries around the globe to try to figure out which broadband and wireless networks are capable of supporting simple through complex cloudy workloads.
This data is mashed up with server installed base figures and projections forward from Gartner and IDC as well as virtualization penetration on those servers to come up with an estimation of what workloads are cloudy – based on the formal definition of cloud computing drawn up last year by the National Institute of Standards and Technology, a standards agency that is part of the US Department of Commerce.
A couple of weeks sweating over an Excel workbook later et voilà, out pops the future landscape of network traffic in the data center and cloud computing. This time around, Cisco is not just looking at the data globally, but allowing for it to be drilled into regionally.
The share of traffic inside, between, and outside of data centers has not changed much since last year, and Cisco is not projecting that it will change much between now and 2016, either.
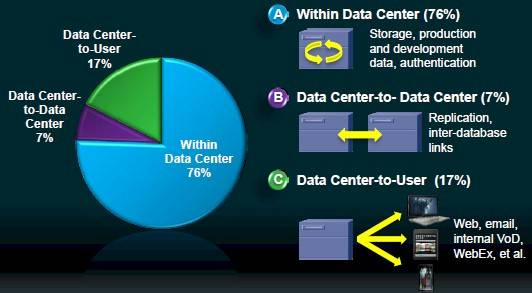
Data Center Network Traffic by Type in 2011
As you can see from the chart above, the vast majority of bandwidth – a whopping 76 per cent – is being eaten up by transmission of information within the data center as servers talk to storage, application tiers distributed across servers talk to each other, and systems authenticate access to themselves. That storage traffic is a big component as companies have shifted to NAS arrays and now SAN links over Ethernet or InfiniBand. In the past, these links would have been over Fibre Channel or SCSI and not something the Ethernet or InfiniBand switching backbone had to handle.
Another 7 per cent of data center traffic was dedicated to replicating applications and database across separate data centers, and the remaining 17 per cent of the capacity on the pipes went to feeding up web pages, email, applications, cloudy services like WebEx and GoToMeeting to end users.
While the ratio of data center bandwidth by type has not changed much in the past two years and is not expected to change much in the coming four years, what Cisco does see is the steady growth in bandwidth consumed across all types of data center traffic.
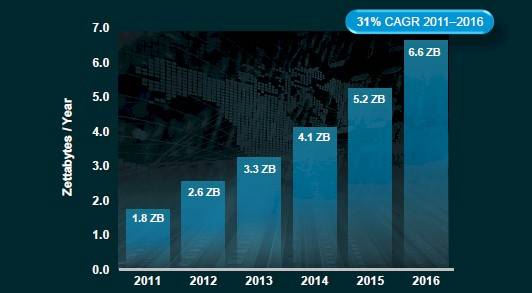
Data Center Network Traffic, 2011 Through 2016
“We are firmly ensconced in the zettabyte era,” says Jain, who calculated that in 2010, data centers handled and aggregate of 1.14ZB of traffic. Cisco had been projecting that 2011 would see 1.65ZB of data center traffic across the world, but the company says that 2011 was more like 1.8ZB.
For 2012, Cisco’s model is projecting 2.6ZB of data will be passed around inside and between glass houses and also directly out to end users accessing apps. By 2016, after a compound annual growth rate of 31 per cent between 2011 and 2016, the data centers of the world will be passing around 6.65ZB of data.
To be precise, Cisco is figuring there will be 467EB (that’s exabytes) of center-to-center traffic, 1.16ZB of data center-to-user traffic, and a whopping 5.02ZB of traffic inside the data center.
Cisco CGI: Cloud Traffic will Dominate Physical and Virtual Server Traffic
The interesting bit is how cloudy workloads will come to dominate that traffic and how physical and simply virtualized servers will get an increasingly smaller share of the bandwidth in the data center. In fact, it looks like their share of the bits passed around will flip between 2010 and 2016.
Jain peels out the growth rates from the chart above, with traditional data center traffic growing 2.2-fold by 2016, which is a CAGR of 17 per cent, compared to cloud data center traffic exploding grow 6.2-fold over the same term, which is a CAGR of 44 per cent.
A lot of that growth with cloud traffic has to do with the uptake of cloudy infrastructure, but it also has to do with the increasing amount of data being pushed around in Asia and Africa, where data centers are cloud houses to begin with, not as an afterthought.
The number of workloads per server is also on the rise on the cloudy side of the data center, and Jain says the Cisco model sees it rising from an average of 4.2 workloads per server in 2011 to 8.5 workloads in 2016.
But for the traditional side of the data center, where you have physical servers or just rudimentarily virtualized ones, the average is only going to rise from 1.5 workloads per server in 2011 to two by 2016.
When you do the math on the cloudy versus traditional servers and the average workloads, it looks like 2014 will be a transition year where more than half of the 135 million workloads in the world will be running on cloudy infrastructure. By 2016, 62 per cent of the 180 million workloads in the data center will be running on cloudy setups.
While one part of the Global Cloud Index peers into data centers to see what is going on there, the other part looks at fixed and wireless networks that end users of all sorts (commercial or consumer) use to get to applications and assesses how ready they are for various levels of cloudy apps.
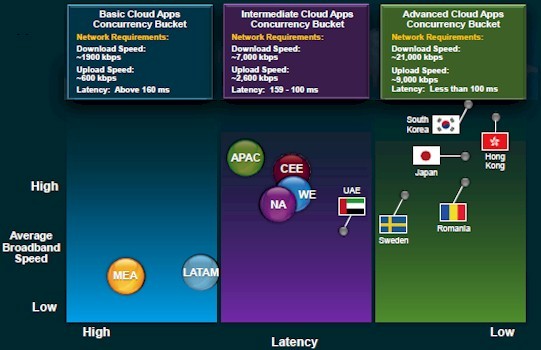
The upshot there is that the fixed networks (mostly broadband Internet) are ready for basic or intermediate cloud apps where bandwidth and latency are not too big of an issue, but that no region is ready for advanced cloud applications and only a few countries have broken through.
Cloud Readiness of Fixed Networks, by Region
On mobile networks, as far as Cisco’s polling of the networks is concerned, no region or country has delivered a network that can do advanced cloud apps where you need download speeds of at least 21Mb/sec, uploads of at least 9Mb/sec, and latency of under 100 milliseconds. Mobile networks can handle basic cloud apps, which have much less sensitivity to bandwidth and latency, and only Western Europe has mobile networks that can handle intermediate cloud apps.
In Cisco’s world, basic apps include simple games and textual applications, while intermediate cloud apps include things like iTunes and iCloud and bulky stuff like ERP and CRM apps. Advanced cloudy apps are things like high def streaming and video conferencing.
“As much as we would like to cut the cord, the mobile networks are just not up to par with fixed networks,” says Jain.
—Reading News from theregister.co.uk
More Cisco News:
Cisco Faces Threat to Core Router Business


